Can Foursquare/Swarm or other social media be viable in life logging and plotting on a map?
Overview
When Foursquare first appeared I was a very happy camper. The app allowed you to “check in” to locations and share with your friends where you were and where you’ve been. It was the perfect way to keep track of places in this digital landscape. Over time they added gamification features like points and badges based on where you’ve checked in. It encouraged a sense of adventure and discovery. For people who wanted to retain their privacy the app still allowed you to check in to locations to add to your digital map. For a time, they focused on features like seeing your history on a map and allowing you to export your checkins.
In 2014 Foursquare split the checkin functionality off to another app: Swarm. Foursquare was to focus on finding businesses, restaurants and providing reviews like Yelp.
Swarm since has consistently updated its app, but has focused on the game features rather than the digital life map. There are still ways to get your checkins out of Swarm to plot on a map, but they are a bit more complicated.
This post will outline the high level steps of what is needed to export and plot your data. It will assume the reader will have knowledge of CSV files, manipulating data within a spreadsheet, and access to Google Drive.
Exporting Your Data From Foursquare/Swarm
Fortunately Foursquare still has a page to export your data, even though they’ve gone on record that they do not support this feature any longer.
By navigating here you can download a KML of your checkins, or a CSV. Each will allow you to plot on Google Maps, but what they do not retain is the latitude and longitude of the location, rather, they rely on geocoding1 to plot on a map. This is problematic as addresses can change. Additionally each of these export methods export every checkin which can get convoluted if you check in to locations multiple times. Checking in to the same location multiple times makes sense from a journalistic format, but if you want to plot places you’ve been to it can quickly over-clutter your map.
You’ll need to modify the URL of the export link in order to include all of your checkins. I suggest modifying it 9999. Example: https://feeds.foursquare.com/history/THISISANEXAMPLESOWHATCOMEATME.rss?count=9999
Optional parameters: You can specify a ‘?count=25’ to pull down a different number of checkins from your history. If you are requesting the ICS or Google Calendar formats your entire history is exported.

Cleaning Your Data From Foursquare
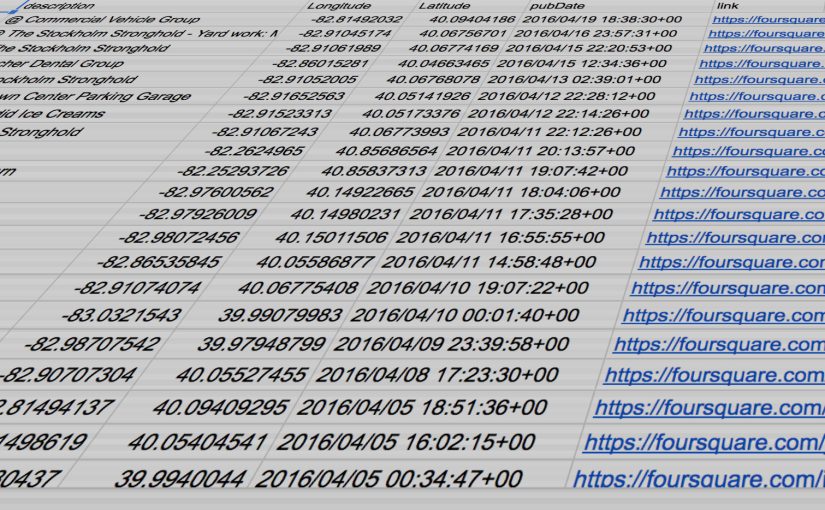
One other format that Foursquare allows you to export as is GeoRSS. GeoRSS is an older format2 but it does contain latitude and longitude information. If you export your data out of Foursquare this way, you can retain latitude and longitude, but you will still have all of your duplicate entries. From here you can go to this site and convert your GeoRSS format to a CSV file which will allow you to modify this data in your favorite spreadsheet application. (See example below)

Within your favorite spreadsheet application (mine is Google Spreadsheets), you can remove duplicates based on a certain column. Now you should have a list of unique location checkins that you can export in CSV, or XLSX.
Plotting Your Data
Google has another application in it’s Google Drive suite called Google Fusion Tables. Fusion Tables allows you to import large data sets and display them in some sort of relevant fashion. Within Fusion Tables you can import your newly created Foursquare export data, and then plot it on a map within Fusion Tables. Once imported you can create a map view.

If you were to leave your duplicate entries intact you can display heat map data to show how often you are in certain areas. Additionally you could choose to filter this data based on your checkin dates, and more.
Once you make your fusion table downloadable you can then finally export your information as a KML file for plotting in Google Earth, Google Maps, or your personal backup.
Summary
So the answer to “Can Foursquare/Swarm or other social media be viable in life logging and plotting on a map?” is: Yes, but damn is it complicated for something that should be simple. I am surprised Swarm isn’t tapping into this a bit more in addition to the gamification options.
Hopefully you’ve found this informational3. Other social media sites that allow you to check in or store additional location data like Flickr4 are a bit harder to work with. Maybe someday I’ll find a way to show you how to work with those. At least while Foursquare allows you to export your data this is still a viable method. I hope other apps will allow you to do stuff with what is and should be your own data.
Next time, I’ll show you what you can do with an old handheld GPS unit.
- Geocoding is the process of reverse engineering an address to a physical location like latitude and longitude. Fortunately this is possible now but constantly needs to be updated with government information. ↩
- “but it checks out.” ↩
- If you are one of the tens of people looking for this. ↩
- Flickr used to be one of the innovators and advocates of geotagged information. They automatically geotagged photos from your EXIF metadata and plotted them on a map. Unfortunately you haven’t been able to see all of your photos on one map in a long time. But I hope one day this will be possible directly from Flickr. ↩
Leave a Reply